 |
|
|
|
Name
Cash Bids
News
Ag Commentary
Weather
Resources
|
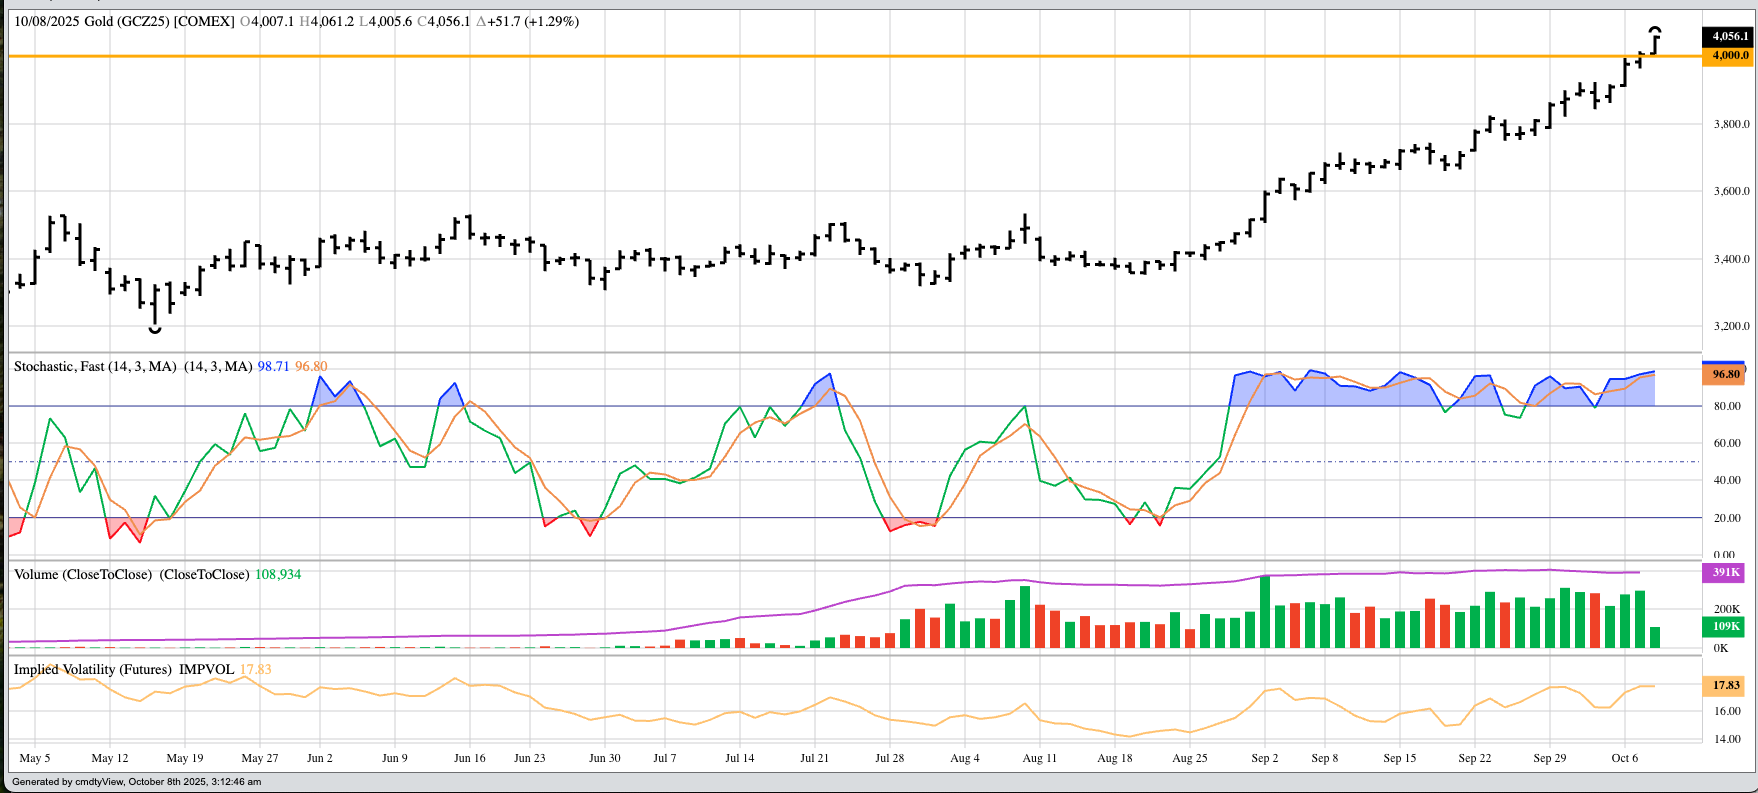
How Soon Could Gold Take Out $5,000?
 When I first fired up the quote screen pre-dawn Tuesday, the US dollar index was again showing a modest gain, but this time around the clock December gold was quietly lower. I then got busy working on a couple long-term studies, knowing I had time before getting to work on Morning Commentary. Turning my attention back to the task at hand, I ran the traps of the commodity complex again and sure enough, gold was back in the green. A couple things immediately came to mind: First, the joke I like to say about a market being harder to hold down than convenience store sushi and second, my Market Rule #4A, a market that can’t go down won’t go down. I would be remiss if I didn’t report the December gold futures contract (GCZ25) did indeed breach $4,000 (per troy ounce) overnight, hitting an early high of $4,000.10. (Dec gold extended its rally to $4.061.20 Tuesday night through Wednesday morning.) How high can the market go? It’s impossible to say given the certain uncertainty that is the hallmark of the global political and economic situation created by…well, you know. 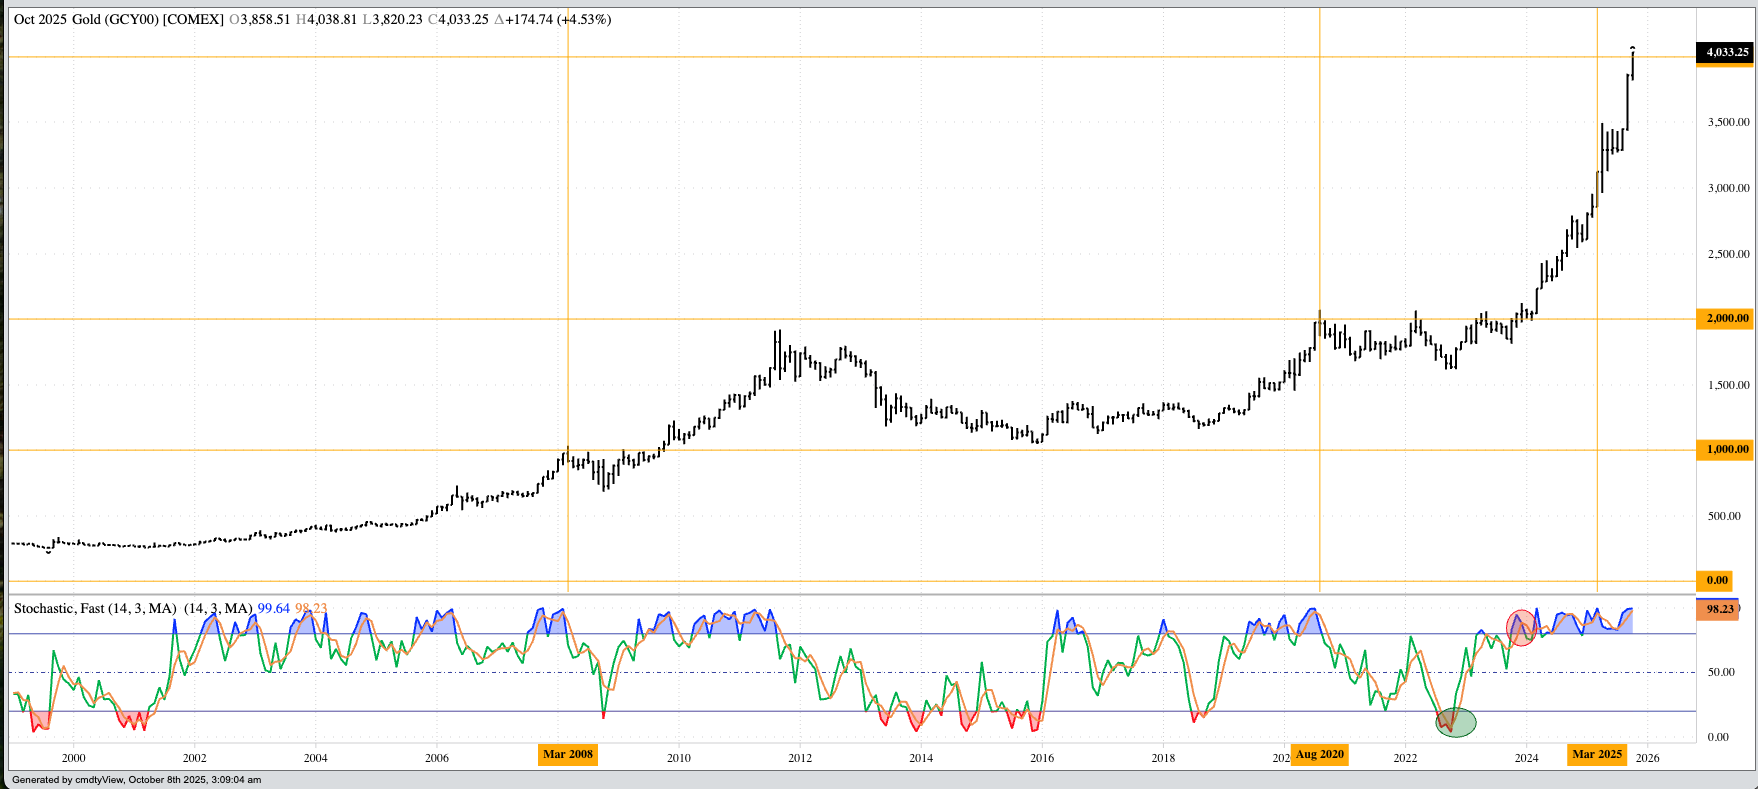 Those of you following along with my monthly analysis for long-term investment positions know I track the Cash Gold Index (GCY00), taking contract rolls and low volume futures contracts (e.g. October, November) out of the picture. In my latest round of Monthly Analysis, the position was unchanged with the Index still in a major (long-term) uptrend, one resembling a runaway train showing no sign of stopping. And as I mentioned to my friends at Kitco News a couple weeks ago, I’ve found it better for my (financial) health to NOT step in front of a train with no brakes. It’s much better to go along for the ride. Until it isn’t. But we’ll cross that bridge when we get there. This morning, I want to focus on a different aspect of the market given futures poked above the $4,000 level. As of this writing, the Index has a high of $4,038.81, up $180 for the month. With the index also blowing through $4,000 during October (2025), it’s track record of climbing the $1,000 ladder looks like this:
Given all this, how soon until the Index tests the $5,000 level? Let’s have some fun with numbers, Fibonacci style:
On the date of publication, Darin Newsom did not have (either directly or indirectly) positions in any of the securities mentioned in this article. All information and data in this article is solely for informational purposes. For more information please view the Barchart Disclosure Policy here. |
|
|