 |
|
|
|
Name
Cash Bids
Market Data
News
Ag Commentary
Weather
Resources
|
Amazon's Free Cash Flow Tumbles, So Is AMZN Worth Buying Here?/Amazon%20-%20Image%20by%20bluestork%20via%20Shutterstock.jpg)
Amazon.com Inc. (AMZN) reported a huge 48% drop in its Q1 12-month trailing (TTM) free cash flow (FCF) due to high capital expenditure (capex) on AI investments. However, the company is still generating cash with positive FCF. As a result, AMZN stock is not doing well, leaving investors wondering whether to buy it. Some investors may want to play AMZN by shorting out-of-the-money (OTM) puts. This article will discuss the reasons why and how this play works. AMZN is down in midday trading to $186.99 on Monday, May 5. That is well off its Feb 4 peak of $242.06, but it is still up from the trough of $16732 on April 21. 
Moreover, fears of the effects of tariffs on Amazon's sales going forward, as well as on its FCF, are dampening the stock's upside. Lower Free Cash FlowOn May 1, Amazon reported that its Q1 2025 FCF fell to $25.9 billion. That was down 48.3% from $50.1 billion in Q1 2024 for the trailing 12 months (TTM) in both periods. Amazon likes to look at its “long-term sustainable free cash flow” (as it points out on page 29 of its 10-Q filing). So it always reports a 12-month look-back figure (TTM) instead of a quarterly result. Despite a 10% increase in its TTM sales from $590.7 billion to $650.3 billion, its TTM FCF dropped 48.3% to $25.9 billion. The table below shows that it was due to a massive increase in its capex expenditures (capex). 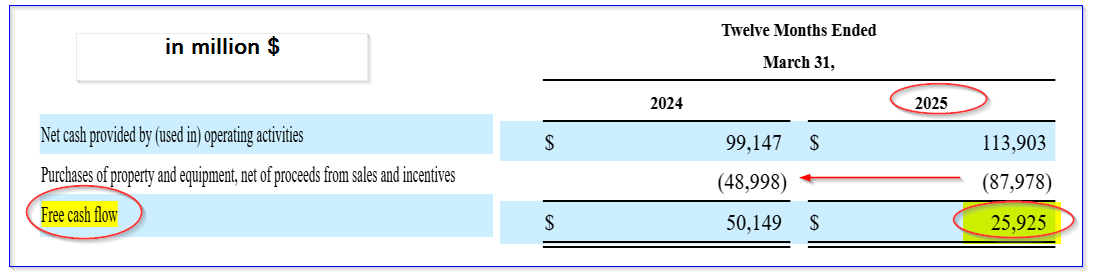
Capex spending rose almost 80% (+79.6%) from $49 billion to $88 billion in the 12 months in Q1 for both years. Note also that capex spending, as a percent of sales, rose from 8.1% last year (i.e., $48b capex /$591b TTM sales) to 13.5% (i.e., $88b/$650b). As a result, investors may have two minds about this. That will affect how they see AMZN's value. On the one hand, absent this huge capex increase, using a % of sales method, Amazon would have generated substantially more free cash flow: $113.9b oper. cash flow - ($650.3b x 8.1%) (i.e., capex as % of sales) = $113.9b - $52.7b = $61.2 billion TTM FCF In other words, the FCF would have been 22% higher than the $50.1 billion a year ago without the extra capex spending. Moreover, that would have been 60% higher than last quarter's TTM FCF figure. More on that later. Dealing With Lower FCF and Tariff FearsOn the other hand, investors fear that with these new Trump tariffs, sales could fall, and with higher capex spending as a percent of sales, FCF could turn negative going forward. Let's look at these fears. First of all, analysts still project higher sales, no matter what happens with tariffs. For example, analysts covered by Seeking Alpha project +8.99% higher sales of $695.3 billion for this year (over $638 billion in 2024) and +9.7% higher next year at $762.85 billion. That is despite the effect of tariffs on its sales. Second, as to the lower free cash flow, the market is already aware of this. It should already be discounted in the stock price. Look at the table below. It shows that FCF has been trending down over the past 6 quarters, despite higher operating cash flow. 
That is due to higher capex spending as a percent of sales and operating cash flow. Note that this past quarter, FCF is 32% lower than last quarter, and Q4 was 19.8% lower than in Q3. This was despite a stable operating cash flow figure for all three quarters, implying that capex spending has been increasing as a percent of sales. The point is that the market knows that Amazon is elevating its capex spending due to AI investments and has already incorporated this trend in the stock price. So, on balance, it seems likely that Amazon will continue to produce positive free cash flow, albeit potentially at a lower figure. One way to look at this is to assume that eventually, Amazon's capex investments will produce even higher cash flow. After all, hasn't Amazon consistently done this throughout its history? The bottom line is that this huge Y/Y drop in free cash flow is not as alarming as it appears. But does that make the stock a buy? Target PricesAnalysts are still positive on AMZN's value going forward. For example, Yahoo! Finance reports that 71 analysts have an average price target of $239.53 per share. That is +28% higher than today's price. Similarly, Barchart's survey shows a mean target of $244.00 per share (+30%). In addition, AnaChart, which tracks analysts' performance, shows that 51 analysts have an average price target of $228.16 per share (+22% from today). The bottom line is that AMZN still looks cheap here to most sell-side analysts. That is despite the effects of tariffs on sales and the lower free cash flow. One way to play AMZN stock - to set a lower buy-in target price and get paid for it - is to short out-of-the-money (OTM) put options in nearby expiry periods. Shorting OTM PutsFor example, look at the June 20 expiry period, 46 days from now. It shows that the $175.00 strike price put option, which is over 6.5% below today's price (i.e., out-of-the-money or OTM), has a high midpoint premium of $3.88 per put contract. That means that a short seller of these puts can make an immediate yield of over 2.2% (i.e., $3.88/$175.00 = 0.02217) while waiting to see if AMZN falls to this price on or before June 20. 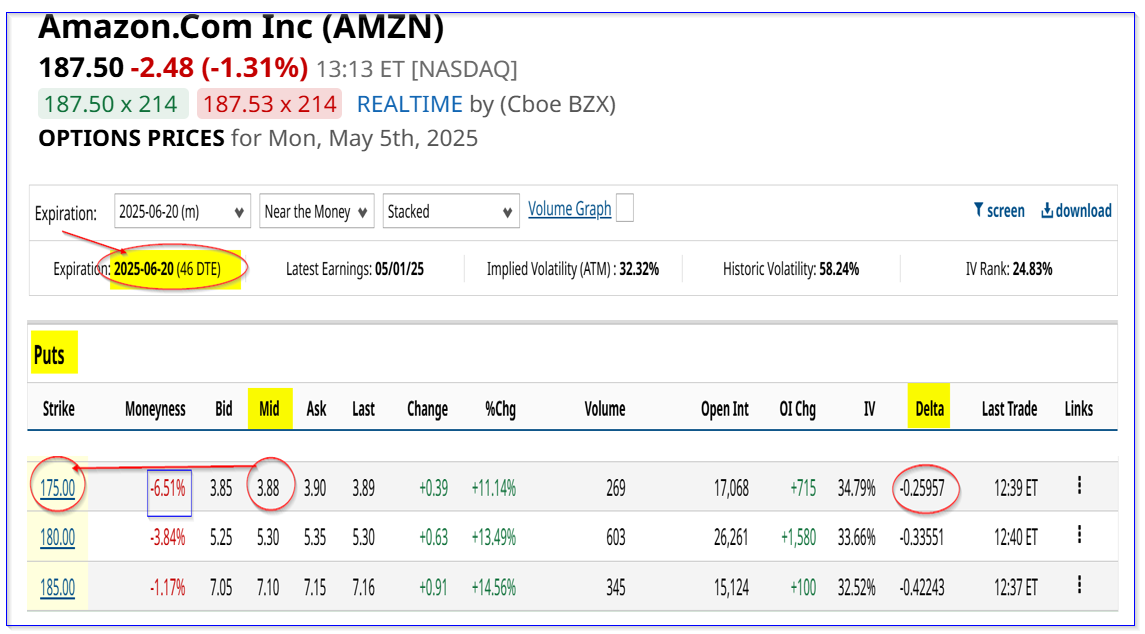
The point is that this is a good way to set a lower buy-in target price and get paid for it. Note that there is a low risk associated with this trade as the delta ratio is just 25.9%. That implies less than a 26% chance that AMZN stock will fall to $175.00 on or before June 20. So, for investors willing to take on more risk, the $180 strike price put option has a higher premium and yield. The short-seller of these puts can make an immediate yield of 2.94% (i.e., $5.30/$180.00). Note also that the breakeven points are lower since the income is received immediately. For example, the $175.00 strike price put play has a breakeven of 171.12, or 8.7% below today's price. The $180 strike price offers a breakeven of $174.70 (i.e., $180-$5.30), or 6.8% lower. This shows that there is good downside protection. Moreover, in effect, this is a way to effectively set a lower buy-in price target for long-term investors. The bottom line is that AMZN looks cheap here, despite its huge decrease in FCF and fears about the effects of tariffs on the stock. One way to play it, for income and a lower buy-in, is to short OTM puts in nearby expiry periods. On the date of publication, Mark R. Hake, CFA did not have (either directly or indirectly) positions in any of the securities mentioned in this article. All information and data in this article is solely for informational purposes. For more information please view the Barchart Disclosure Policy here. |
|
|